library(data.table)Warning: package 'data.table' was built under R version 4.5.2library(fixest)This is another post in my series of attempts to learn the data.table package for R and to get more comfortable with base R graphics. Today, I reimplement the data generating process and one of the models in this excellent blog post by Andrew Baker: How to create relative time indicators. I also strongly recommend watching Andrew’s talk on Difference-in-Differences staggered treatment designs.
For this exercise, we will only use two libraries:
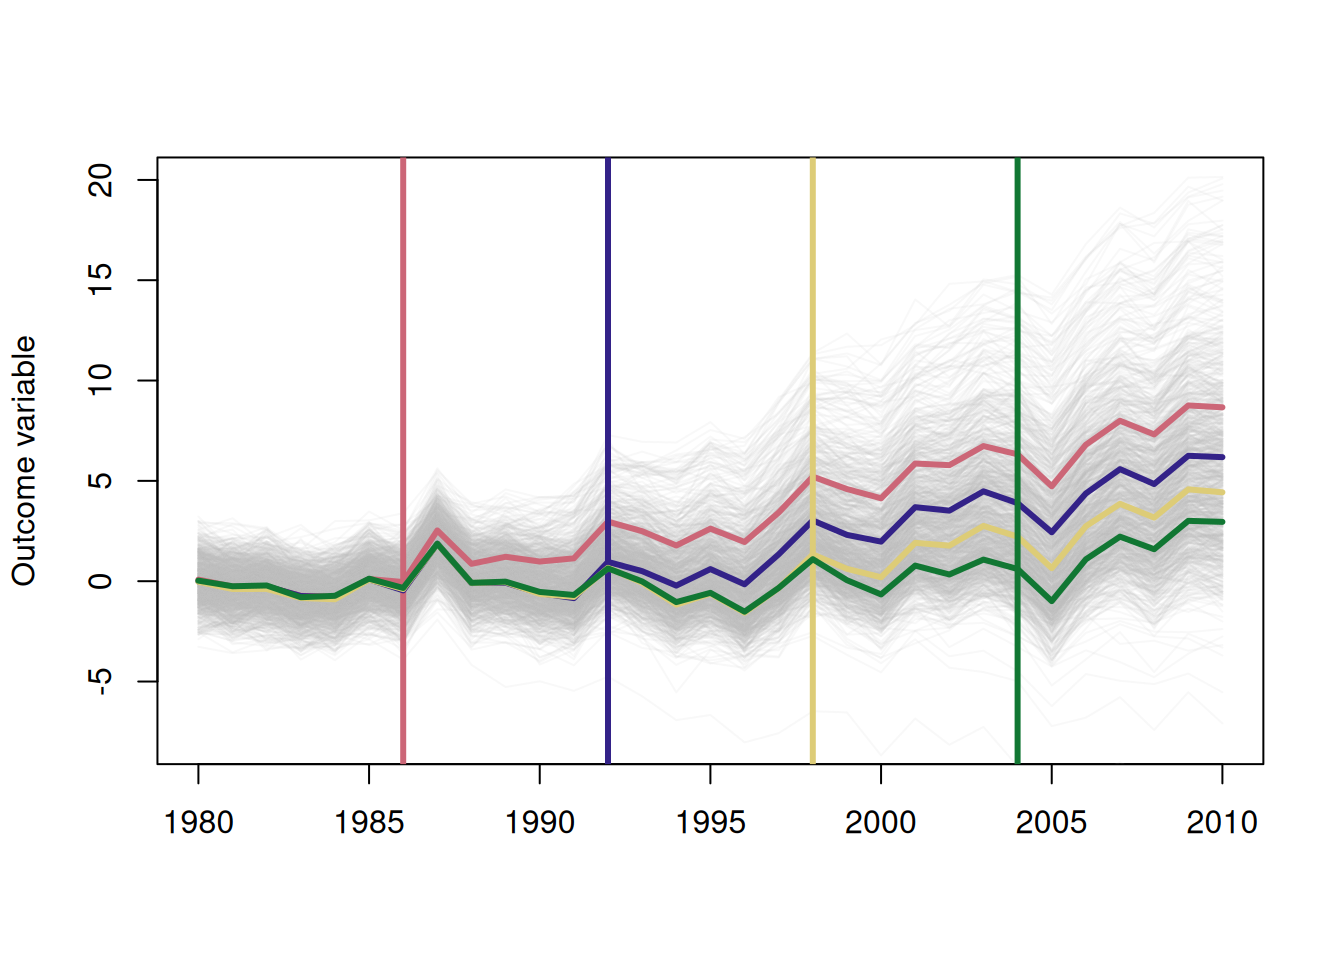
library(data.table)Warning: package 'data.table' was built under R version 4.5.2library(fixest)As in the original post, the data generating process includes unit and time fixed effects, as well as unit-specific treatment effects.
\[y_{it}=\alpha_i + \alpha_t + \tau_{it} + \varepsilon_{it}\] \[\alpha_i,\alpha_t \sim N(0,1)\] \[\varepsilon_{it} \sim N(0,0.5)\] \[\mu_{it} \sim N(0.3,0.2^2)\]
and \(\tau_{it}\) is equal to the sum of each firm-specific \(\mu_{it}\) since the start of the treatment period.
We have 1000 firms split into 4 cohorts which receive treatment in 1986, 1992, 1998, and 2004.
make_data = function() {

  # unit fixed effects
  unit = data.table(
    unit    = 1:1000,
    unit_fe = rnorm(1000, 0, 1),                # unit fe
    state   = sample(1:40, 1000, replace=TRUE), # state id
    mu      = rnorm(1000, .3, .2)               # treatment effect
  )

  # year fixed effects
  year = data.table(
    year    = 1980:2010,
    year_fe = rnorm(31, 0, 1)
  )

  # treatment groups by state
  treat_taus = data.table(
    state       = sample(1:40, 40),
    cohort_year = sort(rep(c(1986, 1992, 1998, 2004), 10))
  )

  # full interaction of unit X year
  out = CJ(
    unit = 1:1000,
    year = 1980:2010
  )
  out = merge(out, unit, by="unit")
  out = merge(out, year, by="year")
  out = merge(out, treat_taus, by="state")

  # error term, treatment indicator, and treatment effects
  out[, error := rnorm(31000, 0, .5)][
      , treat := fifelse(year >= cohort_year, 1, 0)][
      , tau   := fifelse(treat == 1, mu, 0)]

  # cumulative treatment effects
  setkey(out, unit, year)
  out[, tau_cum := cumsum(tau), by="unit"]

  # dependent variable
  out[, dep_var := unit_fe + year_fe + tau_cum + error]

  return(out)

}dat = make_data()
# empty plot window
plot(0,
type = "n",
ylim = c(-8, 20),
xlim = c(1980, 2010),
xlab = "",
ylab = "Outcome variable")
# one line per firm
for (i in 1:1000) {
lines(x = dat[unit==i]$year,
y = dat[unit==i]$dep_var,
col = adjustcolor("grey", alpha=.1))
}
# means by treatment cohort
cohorts = dat[, .(dep_var = mean(dep_var)), by=.(cohort_year, year)]
years <- c(
"#CC6677" = 1986,
"#332288" = 1992,
"#DDCC77" = 1998,
"#117733" = 2004
)
for (y in years) {
abline(v = y,
col = names(years)[years==y],
lwd = 3)
lines(x = cohorts[cohort_year==y]$year,
y = cohorts[cohort_year==y]$dep_var,
col = names(years)[years==y],
lwd = 3)
}
# simulate data
dat = make_data()

# drop 2004 treatment
dat = dat[year <= 2003]

# years since/to treatment
dat[, rel_year := year - cohort_year]
min_year = dat[cohort_year==2004, min(rel_year)]
max_year = dat[cohort_year==2004, max(rel_year)]

# identification requires dropping two dummies
# dat[, rel_year := fifelse(!rel_year %in% c(min_year, -1), as.character(rel_year), "omitted")][
    # , rel_year := factor(rel_year)][
    # , rel_year := relevel(rel_year, ref=c("omitted")]
dat[, rel_year := factor(rel_year, sort(unique(rel_year)))]

# regression model
f = dep_var ~ rel_year | unit + year
mod = feols(f, data=dat)
The variables 'rel_year13', 'rel_year14', 'rel_year15', 'rel_year16' and
'rel_year17' have been removed because of collinearity (see $collin.var).# clean results
out = data.table("term" = names(coef(mod)), "estimate" = coef(mod))
out = out[ , term := as.numeric(gsub(".*year", "", term))]
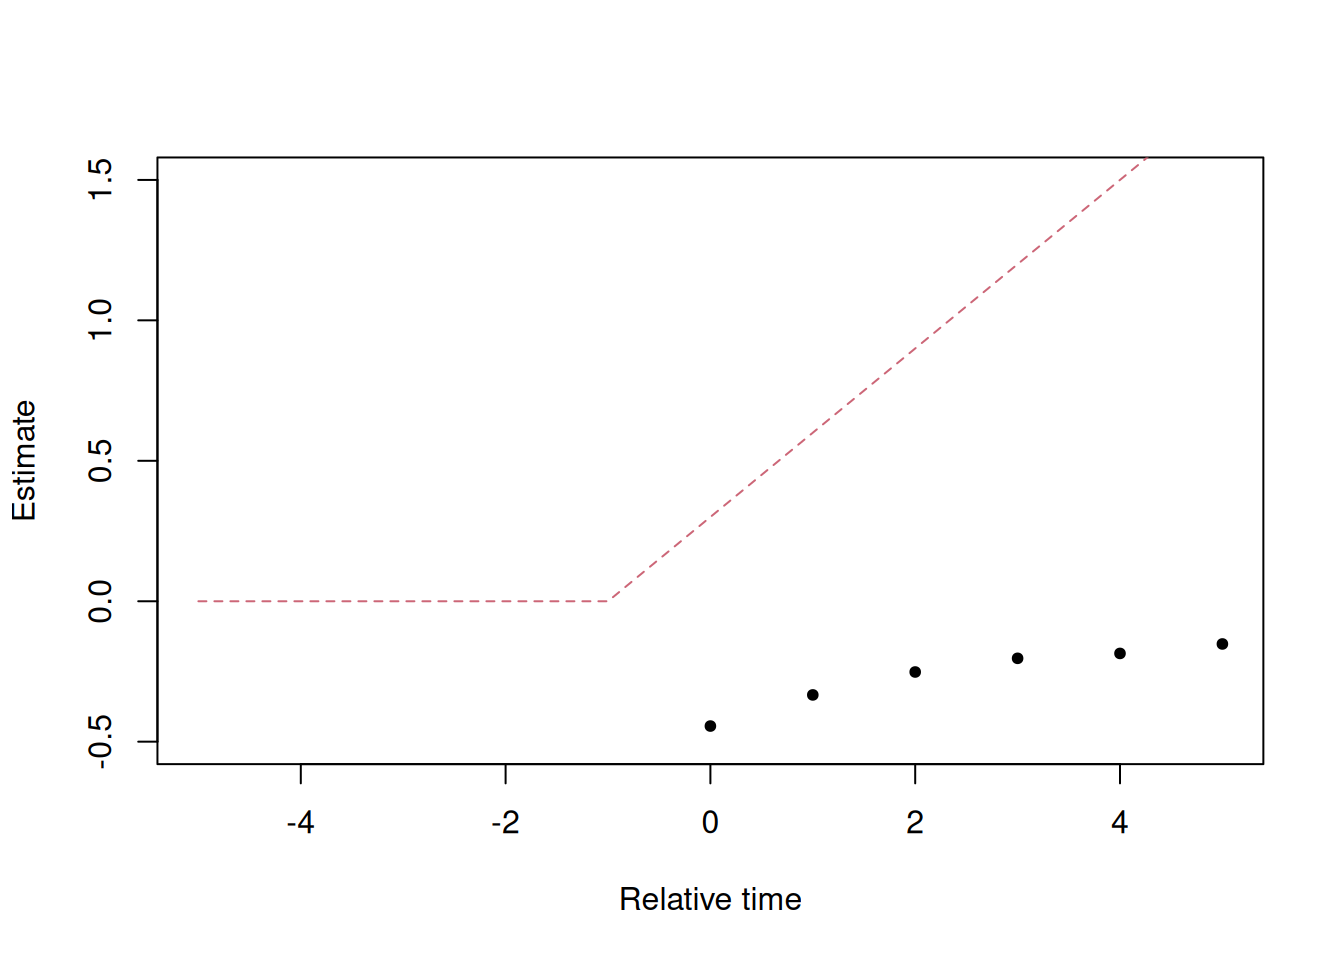
out = out[term %in% -5:5]# event study estimates
plot(x = out$term,
y = out$estimate,
pch=20,
xlim = c(-5, 5),
ylim = c(-.5, 1.5),
xlab = "Relative time",
ylab = "Estimate")
# truth
truth = data.table(term=-5:5)
truth[, estimate := fifelse(term >= 0, (term + 1) * .3, 0)]
lines(x = truth$term,
y = truth$estimate,
col = "#CC6677",
lty = "dashed")