library(marginaleffects)
library(patchwork)
library(ggplot2)
library(mgcv)
theme_set(theme_bw())

dat <- "https://vincentarelbundock.github.io/Rdatasets/csv/Stat2Data/Titanic.csv"
dat <- read.csv(dat)In a blog post, Andrew Gelman (2024) relays this question:
“The subgroups they examine are 65-74 years old, 75-84, and >85. I’ve seen these types of binning common in medical studies. But why? The actual ages are certainly known, so why not treat age as a continuous variable?”
Gelman’s answer is:
“Discrete binning isn’t perfect, but it’s transparent and can be better than a simple linear model.”
The idea is that fitting a model with multiple coefficients associated with bin-specific binary variables allows more flexibility than a model where age is entered purely linearly, with a single coefficient. The downsides of this strategy are that binning “wastes” information by coarsening a fine-grained measure and that the cutpoints of the age bins can sometimes feel arbitrary.
As Gelman notes, however, analysts can get the best of both worlds by including age as both a set of bins and as a single continuous variable.
Here, I use the marginaleffects package to illustrate four different approaches to modeling age:
- Linear
- Discrete
- Linear and discrete
- Spline (via a Generalized Additive Model)
First, we load libraries and the Titanic data from the Rdatasets archive:
Then, we fit 4 different logistic regression models.
To create bins, we manually enter the cutpoints in the model-fitting formula, using the I() syntax. This will allow us to work with marginaleffects functions later for plotting and interpretation. For somewhat arbitrary reasons, we use quartiles as cutpoints for our bins:
summary(dat$Age) Min. 1st Qu. Median Mean 3rd Qu. Max. NA's
0.17 21.00 28.00 30.40 39.00 71.00 557 For the model with a spline, we use the gam() function from the mgcv package:
# Linear
m1 <- glm(
    Survived ~ Age,
    family = binomial,
    data = dat)

# Discrete
m2 <- glm(
    Survived ~ I(Age <= 21) + I(Age > 21 & Age <= 30) + I(Age > 30 & Age <= 39),
    family = binomial,
    data = dat)

# Linear & Discrete
m3 <- glm(
    Survived ~ Age + I(Age <= 21) + I(Age > 21 & Age <= 30) + I(Age > 30 & Age <= 39),
    family = binomial,
    data = dat)

# Spline
m4 <- gam(
    Survived ~ s(Age),
    family = binomial,
    data = dat)
After fitting the models, we can plot the predicted probability of survival for different ages using the plot_predictions() function. As Gelman notes, the
“fitted model looks kind of goofy: it’s a step function with a slope, so it has a bit of a sawtooth appearance”
p1 <- plot_predictions(m1, condition = "Age") + ggtitle("Linear")
p2 <- plot_predictions(m2, condition = "Age") + ggtitle("Discrete")
p3 <- plot_predictions(m3, condition = "Age") + ggtitle("Linear + Discrete")
p4 <- plot_predictions(m4, condition = "Age") + ggtitle("Spline")

p1 + p2 + p3 + p4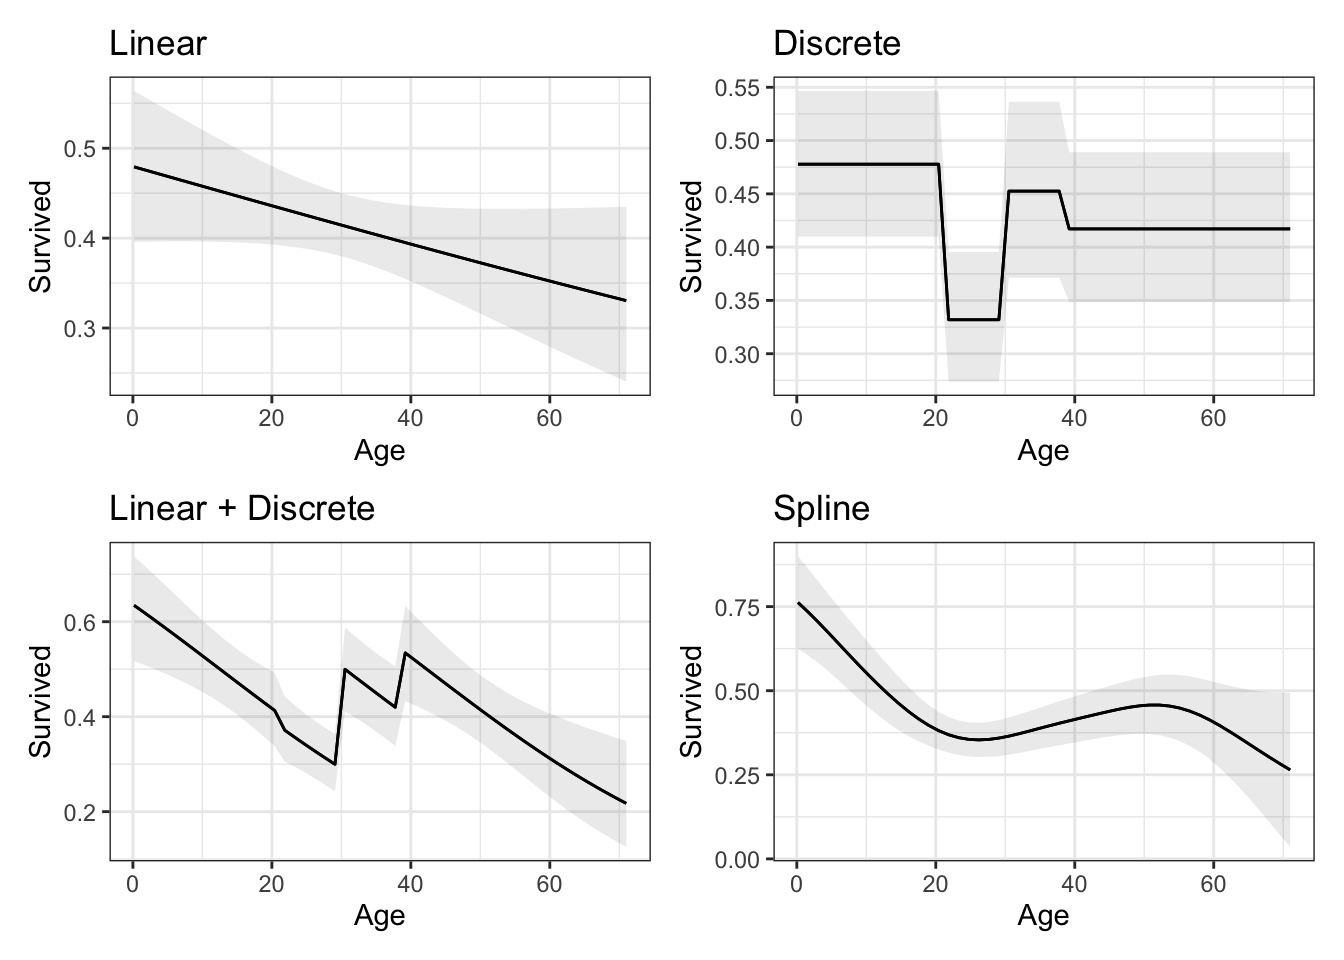
We can also use the avg_comparisons() function to compute the average effect of increasing the Age variable by 1 unit on the predicted probability of survival. As you can see, there appear to be meaningful differences in the estimates:
avg_comparisons(m1)
 Estimate Std. Error     z Pr(>|z|)   S    2.5 %   97.5 %
 -0.00212    0.00125 -1.69   0.0902 3.5 -0.00458 0.000333

Term: Age
Type: response
Comparison: +1avg_comparisons(m2)
 Estimate Std. Error      z Pr(>|z|)   S    2.5 %  97.5 %
 -0.00169    0.00185 -0.914     0.36 1.5 -0.00532 0.00194

Term: Age
Type: response
Comparison: +1avg_comparisons(m3)
  Estimate Std. Error      z Pr(>|z|)   S    2.5 %  97.5 %
 -0.000438    0.00187 -0.234    0.815 0.3 -0.00411 0.00324

Term: Age
Type: response
Comparison: +1avg_comparisons(m4)
 Estimate Std. Error    z Pr(>|z|)   S    2.5 %    97.5 %
 -0.00322     0.0014 -2.3   0.0215 5.5 -0.00596 -0.000474

Term: Age
Type: response
Comparison: +1
References
Gelman, Andrew. 2024. “What?” https://statmodeling.stat.columbia.edu/2024/06/19/what/.